Try the Tool!
A JavaScript/HTML-based Graph Plotter to Visualize My Car’s Stats Exported by BlueDriver


User Guide: Plotting BlueDriver Graphs
Step 1 — Prepare Your Vehicle and the BlueDriver App
- Start your vehicle (just turning the ignition ON may be enough in some cases).
- Plug your BlueDriver dongle into the OBD-II port (usually under the steering wheel).
- Open the BlueDriver app on your phone.
- Make sure the app is properly connected to the OBD-II dongle.
Step 2 — Record a Data Session (Stats)
-
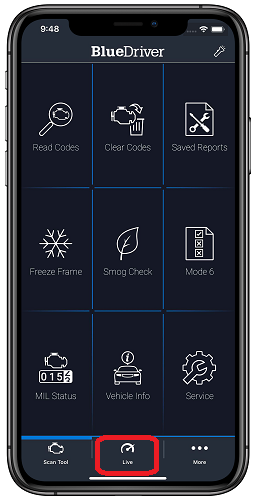
In the BlueDriver app:
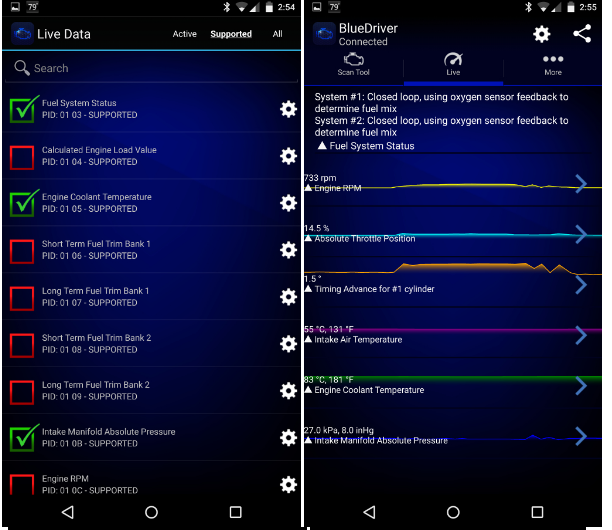
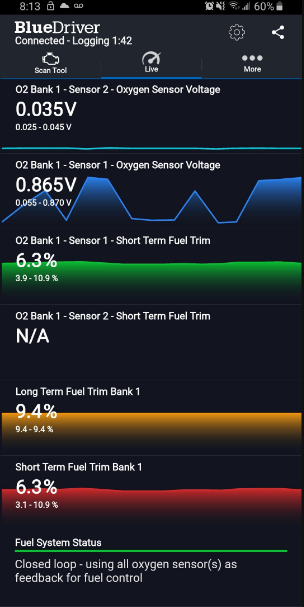
- Go to “Advanced Mode” or Live Data
- Tap “Select PIDs” and choose the statistics you want to log, e.g., Engine RPM, Engine Load, Lambda, Fuel Pressure, etc.
- Click “Start” to begin data recording
-
Drive normally or perform specific tests (acceleration, load, etc.).

-
Once the session is finished:
- Tap “Stop”
- Then tap “Export” or “Share”
- Select the CSV format and send the file to yourself (email, Google Drive, etc.)
IMPORTANT NOTE: If you turned off the vehicle at the end, some invalid stats may be at the end of the file — I suggest trimming the last 3-5 seconds in that case.
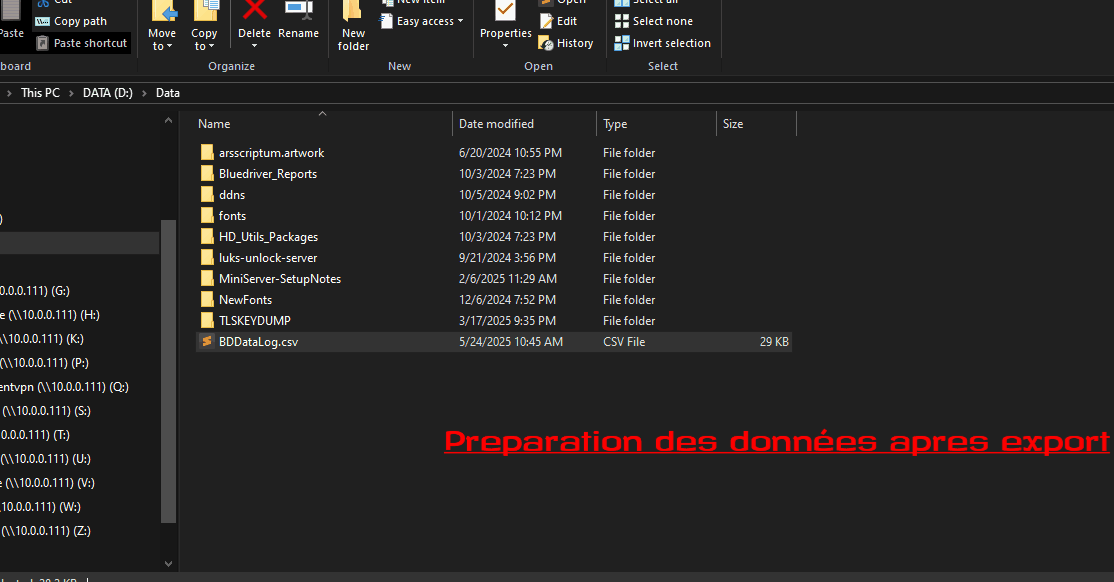
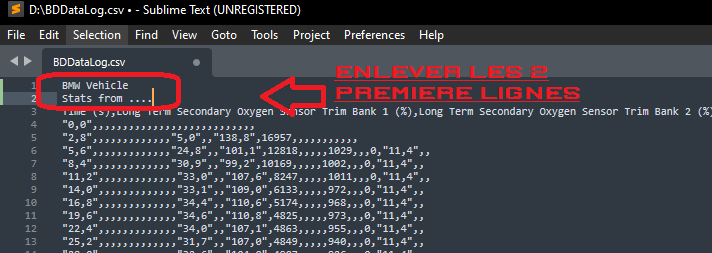
Step 3 — Prepare the Data File
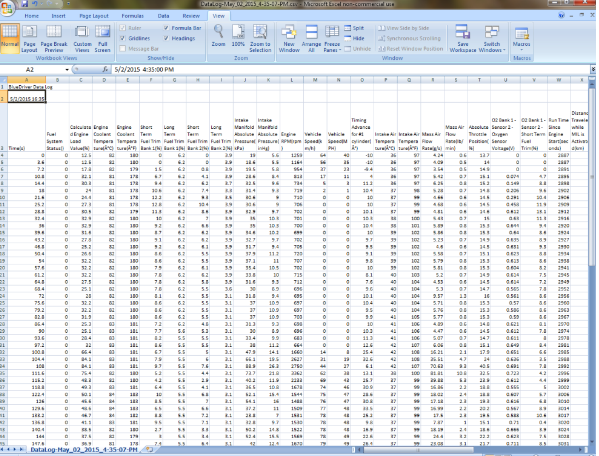
- The exported file is a CSV — a text file with comma-separated data.
- Remove the first two lines so only the stat headers remain. See Example
- Trim the last few seconds if the vehicle was turned off at the end, to remove invalid stats.
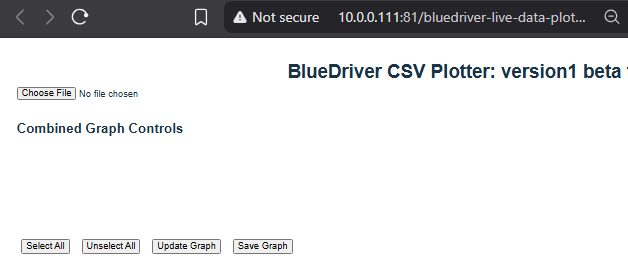
Step 4 — Load the File in the Visualization Tool
- Open your visualization tool (HTML/PHP/JS or PowerShell version).
- Click “Browse” or “Load CSV File”
- Select your .csv BlueDriver file (e.g.,
BDDataLog XXX.csv) - The tool automatically analyzes the available columns.
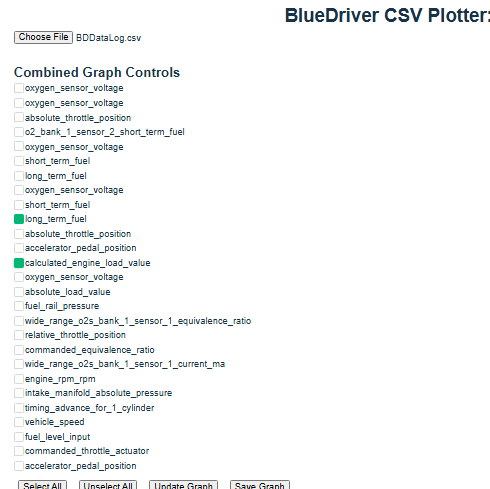
Step 5 — Select the Data to Display
- A list of checkboxes will appear with all the available data types.
- Check the boxes for the data you want to display (e.g.,
RPM,Timing,Engine Load). -
You can use these buttons:
- “Select All” to check everything
- “Deselect All” to quickly uncheck all
Step 6 — Display and Interact with the Graphs
-
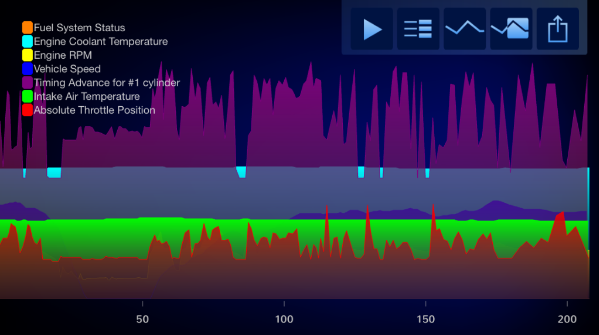
The selected data is displayed as dynamic charts:
- X-axis: Time (seconds)
- Y-axis: Sensor values
-
You can:
- Hover to see precise values
- Click to freeze a point
- Compare multiple sensors side-by-side
Step 7 — Save the Graph
- Click the “Save Image” button
- A .png image of the current graph is generated and downloaded automatically.
Step 8 — Read Sensor Definitions
- At the bottom of the page, there’s a “Definitions” section
-
Click the name of a sensor in the list to be redirected to its description:
- Example:
Timing Advance→ explanation of ignition timing Load→ explanation of calculated or absolute engine load
- Example:
Try the Tool!
Get the code
bluedriver-live-data-plotter on GitHub
bluedriver-live-data-plotter ZIP PACKAGE on GitHub
